
llmfit answers one question: which open-source LLMs will run well on the machine in front of you. It reads your CPU, RAM, GPU and VRAM, then scores hundreds of models on memory fit, speed, quality and context, and ranks them. Written in Rust, MIT licensed, no account, no telemetry.

The repo went from first commit on 15th February 2026 to 35,194 stars in under 7 months, which is unusual for a hardware sizing tool. Current release is v1.1.14, and the version is the same on crates.io, PyPI and Homebrew. 09 Sep 2026
What it does
- Detects your hardware. CPU cores, total and available RAM, discrete and integrated GPUs, VRAM, unified memory. Covers NVIDIA CUDA, Apple Metal, AMD ROCm, Intel SYCL and Ascend NPU.
- Ranks the model catalog. Hundreds of models scraped from the HuggingFace API, scored across 4 dimensions and sorted.
- Picks the quantization for you. It walks Q8_0 down to Q2_K and takes the best quality that still fits.
- Measures instead of guessing.
llmfit benchruns a real benchmark against your provider and replaces the estimate with a measured number. - Shares results.
llmfit bench --shareopens a PR with your numbers, straight from the TUI. Merged submissions ship in the next release, so anyone on identical hardware gets measured figures without running anything. - Serves an API.
llmfit serveexposes/api/v1/systemand/api/v1/modelsplus a web dashboard.
It knows about local runtime providers too: Ollama, llama.cpp, MLX, LM Studio, Docker Model Runner and vLLM. The TUI shows which are installed and how many models each already holds.
For business people
The problem llmfit solves is buying decisions and wasted afternoons. You want to run a model locally for privacy or cost reasons, and the only honest answer to "will this work on my machine" has usually been to download 40 GB and find out.
Where it earns its place:
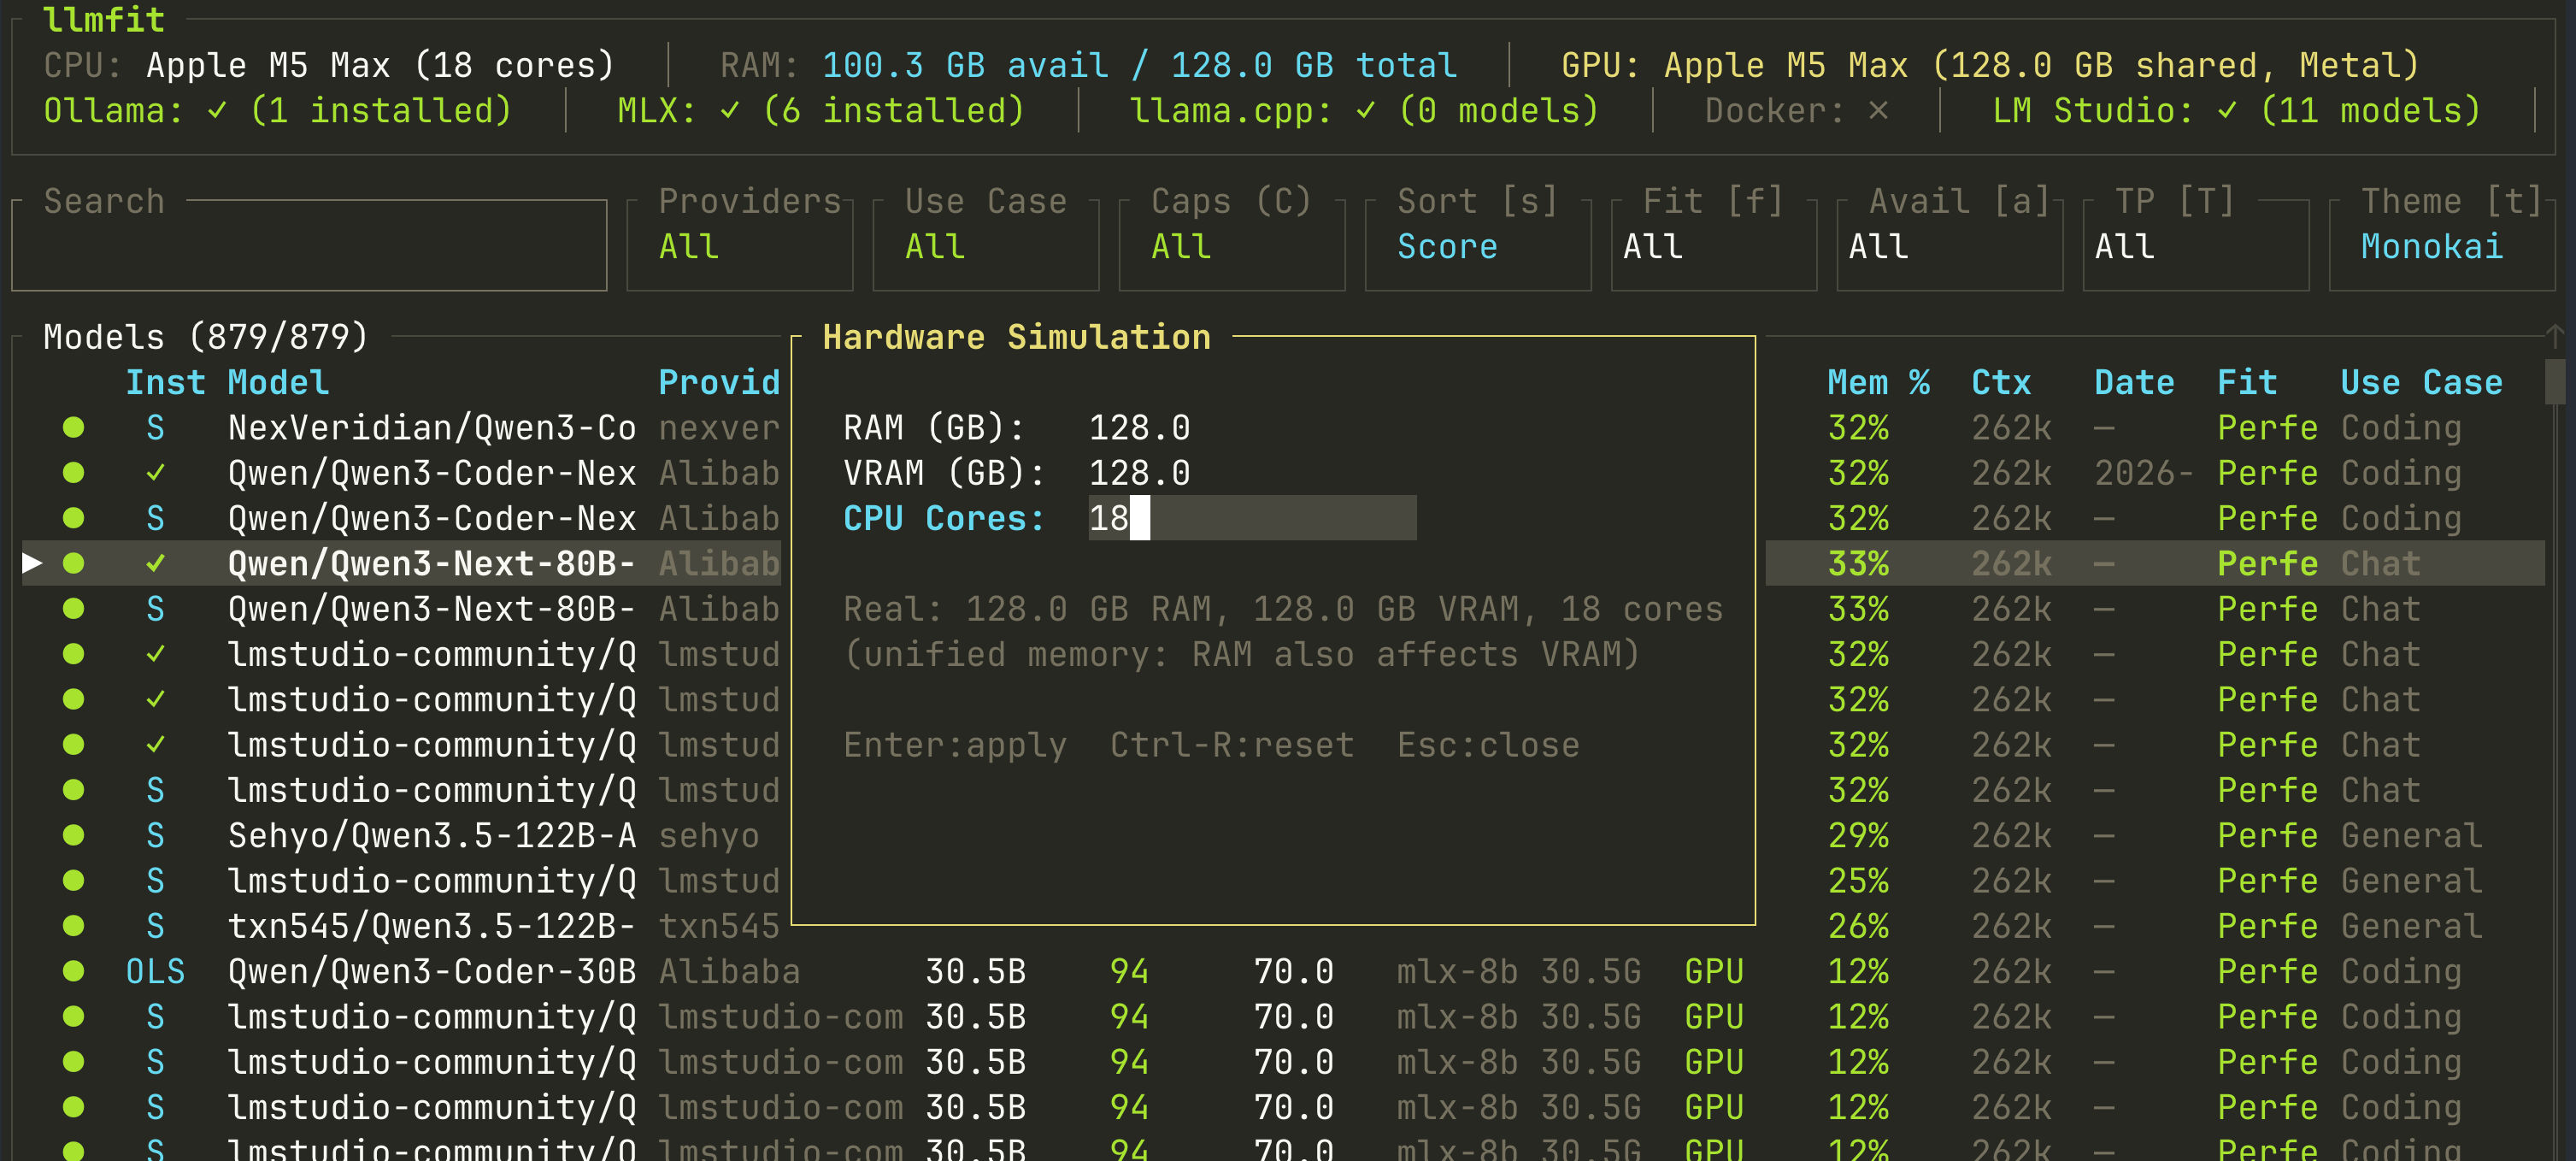
- Before you buy hardware. The TUI has a hardware simulation mode. Type in the RAM, VRAM and core count of a machine you are considering, and it re-ranks the whole catalog against those numbers. That turns a 4,000 EUR purchase into a checkable question.
- Before you pick a model. It tells you not just what fits, but what fits with headroom. The sweet spot it optimises for is 50 to 80% memory use, because a model filling 96% of your VRAM will not load in practice.
- When someone asks what local AI costs. The answer is the hardware, and llmfit prices the hardware against the model you actually want.
Cost: nothing. MIT licence, and the privacy policy is short. It only contacts the network when you ask it to (model downloads, provider queries, the leaderboard).
The limitation to keep in mind: most numbers are estimates from a formula, not measurements. The tool is honest about this and labels every figure with a confidence level, from measured_local down to estimated. Treat an estimated tok/s as a planning number, then run llmfit bench before you commit.
For technical people
Scoring
Each model gets 4 scores, 0 to 100, combined into a weighted composite. The weights shift by use case, so Chat weights Speed at 0.35 while Reasoning weights Quality at 0.55.
| Dimension | What it measures |
|---|---|
| Quality | Parameter count, family reputation, quantization penalty, task alignment |
| Speed | Estimated tokens/sec from backend, params and quantization |
| Fit | Memory use efficiency, sweet spot 50 to 80% of available memory |
| Context | Context window against the target for the use case |
Speed estimation
Token generation is memory-bandwidth-bound: every token reads the full weights once. So the core formula is straightforward.
tokens_per_sec = (bandwidth_GB_s / model_size_GB) × 0.55
The 0.55 efficiency factor covers kernel overhead, KV-cache reads and memory controller effects, and it is tunable in the TUI. The bandwidth table covers about 80 GPUs. For anything unrecognised it falls back to a per-backend constant: CUDA 220, Metal 160, ROCm 180, SYCL 100, CPU ARM 90, CPU x86 70, Ascend NPU 390.
Prefill is handled separately because it is compute-bound, roughly 2 × active_parameters FLOPs per prompt token. llmfit only reports ttft_ms when it knows the GPU's fp16 throughput, and returns null rather than 0.0 when it does not.
MoE
Mixture-of-Experts models are detected from the HuggingFace config (num_local_experts, num_experts_per_tok) and estimated from active parameters, not total. Mixtral 8x7B has 46.7B parameters but activates about 12.9B per token, which drops VRAM from 23.9 GB to roughly 6.6 GB with expert offloading. This is the feature the main alternative lacks.
Fit verdicts
The verdict is a function of pool utilization (memory_required / memory_available), then capped by the run mode.
| Pool utilization | Verdict |
|---|---|
| 60% or less | Perfect |
| 85% or less | Good |
| 98% or less | Marginal |
| Above 98% | Too Tight |
GPU and tensor-parallel modes keep the raw verdict. MoE offload, CPU+GPU and CPU cap at Good, because Perfect means "room to spare and running on the GPU". The band stops at 98% rather than 100% to leave allocator slack.
Install
# macOS / Linux, prebuilt binary
brew install AlexsJones/llmfit/llmfit

# macOS / Linux, one-liner
curl -fsSL https://llmfit.axjns.dev/install.sh | sh

# Windows
scoop install llmfit

# Python toolchain
uv tool install -U llmfit
uvx llmfit                 # run without installing

# Docker
docker run -it --rm ghcr.io/alexsjones/llmfit --tui

# From source
cargo build --release
Usage
llmfit                        # interactive TUI, the default
llmfit fit                    # all models ranked by fit, as a table
llmfit recommend --json       # top picks as JSON, for scripts and agents
llmfit info "<model>"         # one model: fit, estimate basis, verify commands
llmfit bench                  # measure real tok/s and TTFT
llmfit doctor                 # hardware detection report, for bug reports
llmfit serve --port 8787      # HTTP API plus web dashboard
The JSON output is the useful part for automation. llmfit recommend --use-case coding | jq '.models[].name' gives you a ranked shortlist you can feed straight into a download script.
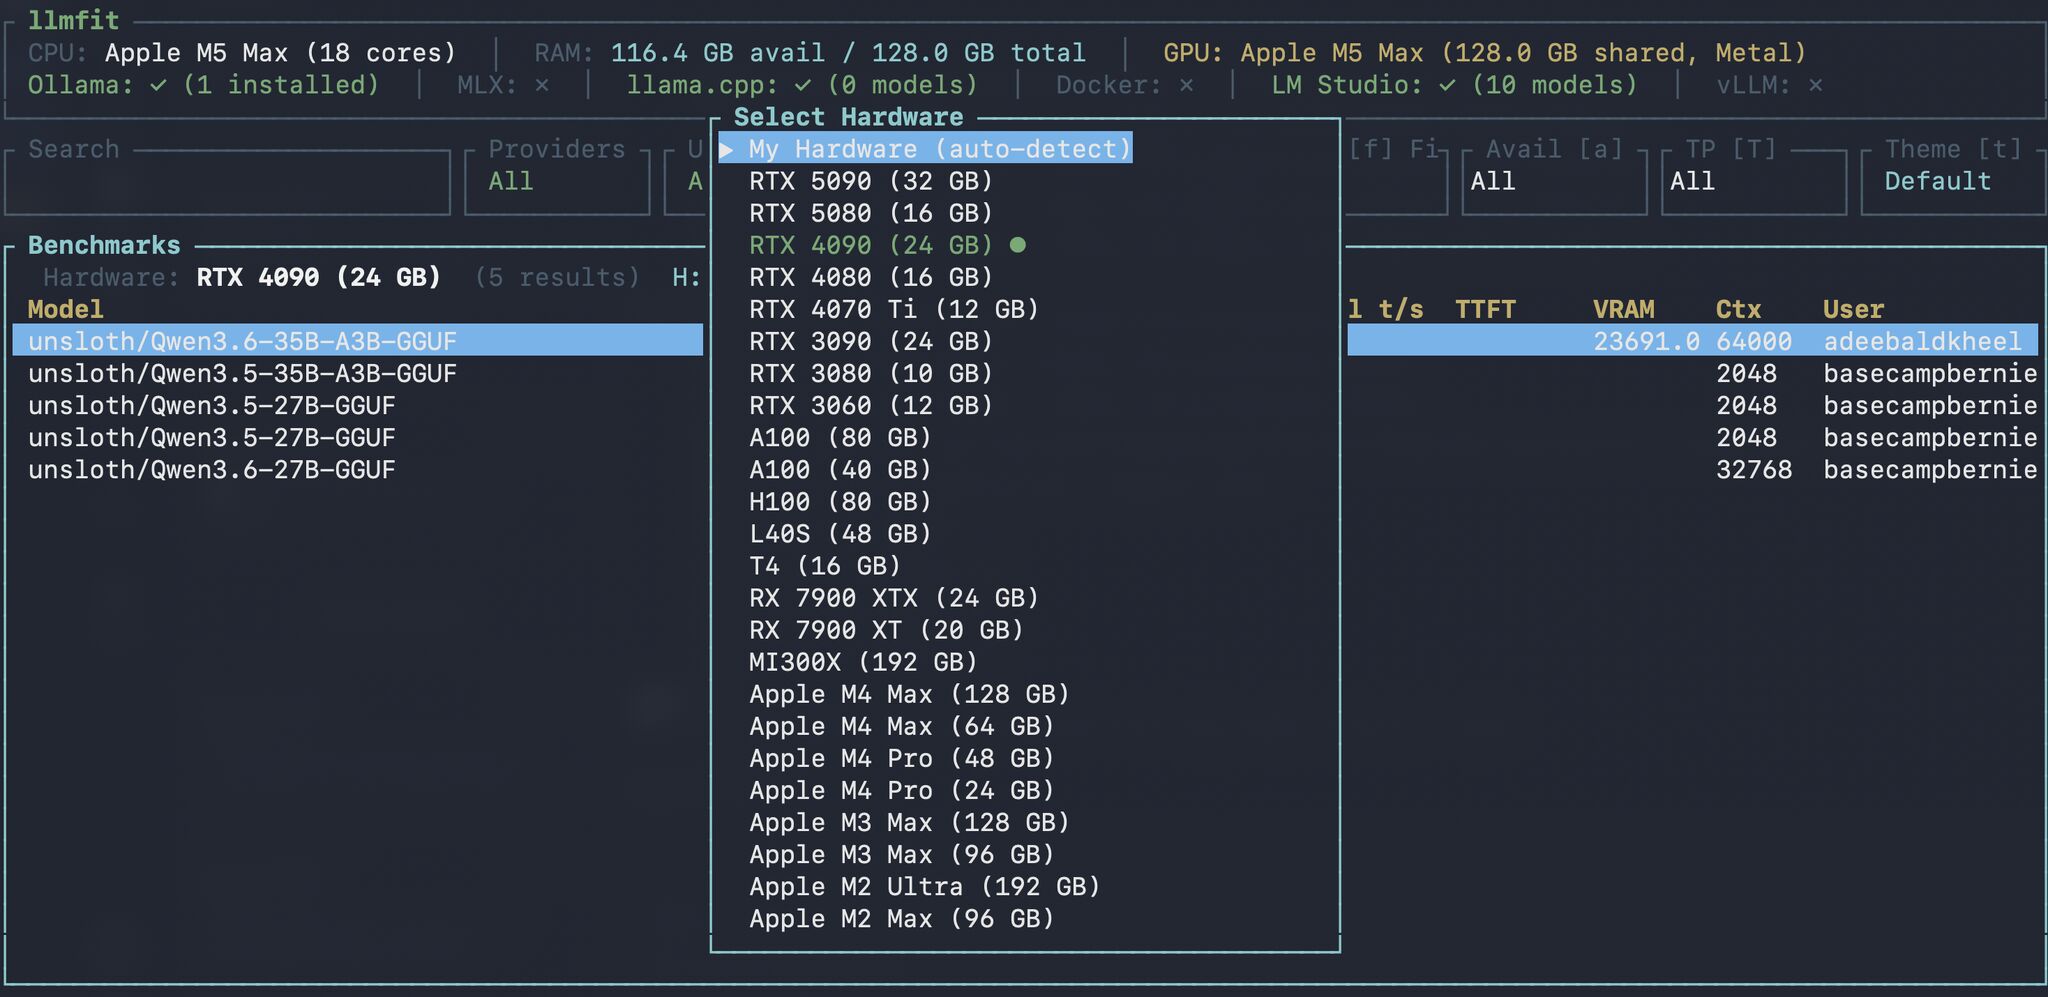
The community leaderboard lets you pick someone else's hardware and read their measured numbers. Useful when you are deciding between an RTX 5090 and a 128 GB Mac.
Alternatives
llm-checker is the closest thing: a Node.js CLI that pulls and runs models through Ollama rather than estimating from specs. More hands-on, and it gives you real numbers by definition. It does not model MoE architectures, so memory estimates for Mixtral or DeepSeek-V3 use total parameters and come out badly wrong.
The same author also maintains llmserve, a TUI for serving a local model, and llama-panel, a native macOS app for managing llama-server instances.
My take
Worth installing on any machine where you run local models. The hardware simulation mode alone justifies it: instead of guessing whether more unified memory buys you a bigger model, you type the number in and read the answer.
The honesty about estimate confidence is what makes it trustworthy. Most sizing tools hand you a number with no provenance. This one tells you whether it measured, calibrated or guessed, and llmfit info prints the commands to check it yourself.
Run llmfit bench once on your own machine before trusting any speed figure, and contribute the result back. That is the whole point of the leaderboard.
Further reading
- llmfit on GitHub
- How llmfit works, the scoring and estimation formulas
- CLI and automation reference
- Benchmarking guide