

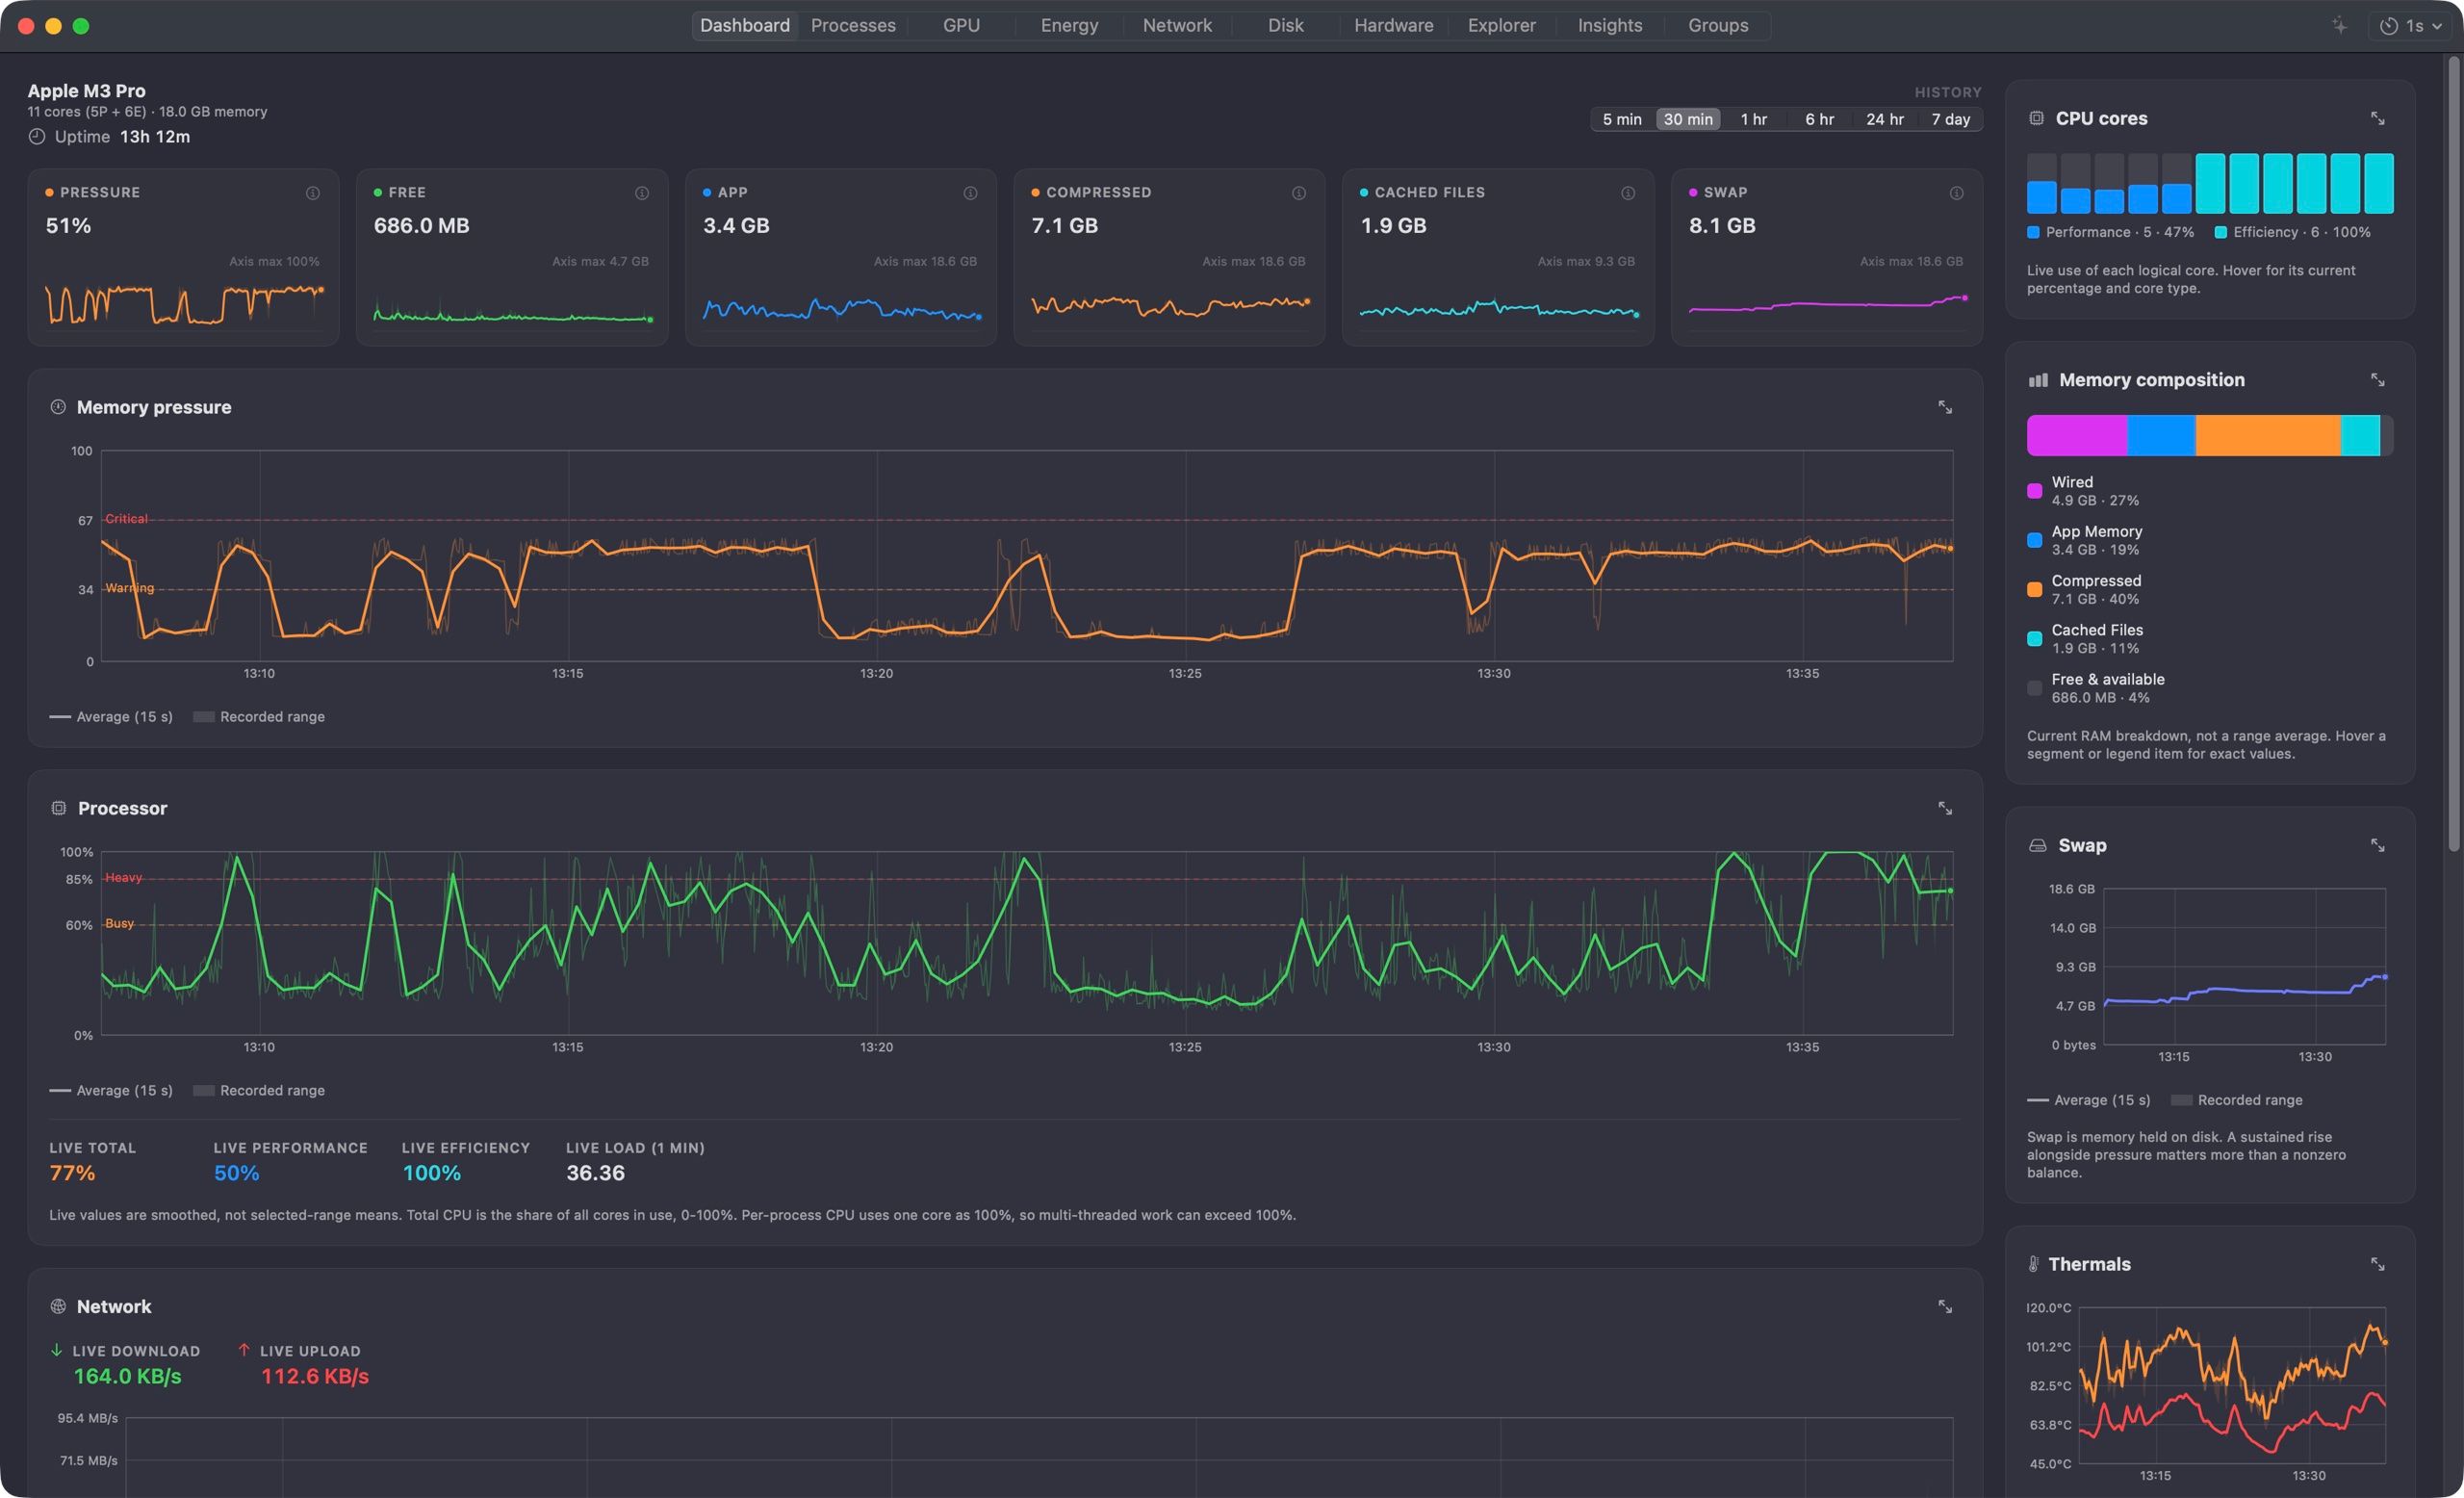
Mac Performance Monitor is a native Mac app that shows what your Mac is doing now and records what it did before. Activity Monitor shows the present. This app keeps a history, so when the fans spin up or everything freezes, you can go back to that minute and see which process was responsible.
It runs as a menu bar readout, a quiet background recorder, or a full window. It's free, MIT-licensed, and sends no usage data anywhere.
| Language | Swift 6 and SwiftUI, SQLite storage through GRDB |
| Needs | Apple silicon and macOS 15 Sequoia or later. No Intel support |
| Licence | MIT |
| Version | 2.2.1, 23rd September 2026. First commit in July 2026, about 20 releases since |
| Popularity | About 630 GitHub stars |
| Install | Signed and notarised .pkg, or Homebrew. Updates through Sparkle |
| Languages | English, Simplified Chinese, German and French |
What it does
- History, not a snapshot. A recorder keeps samples at the detail and retention you choose, up to 7 days on the dashboard and months for battery health.
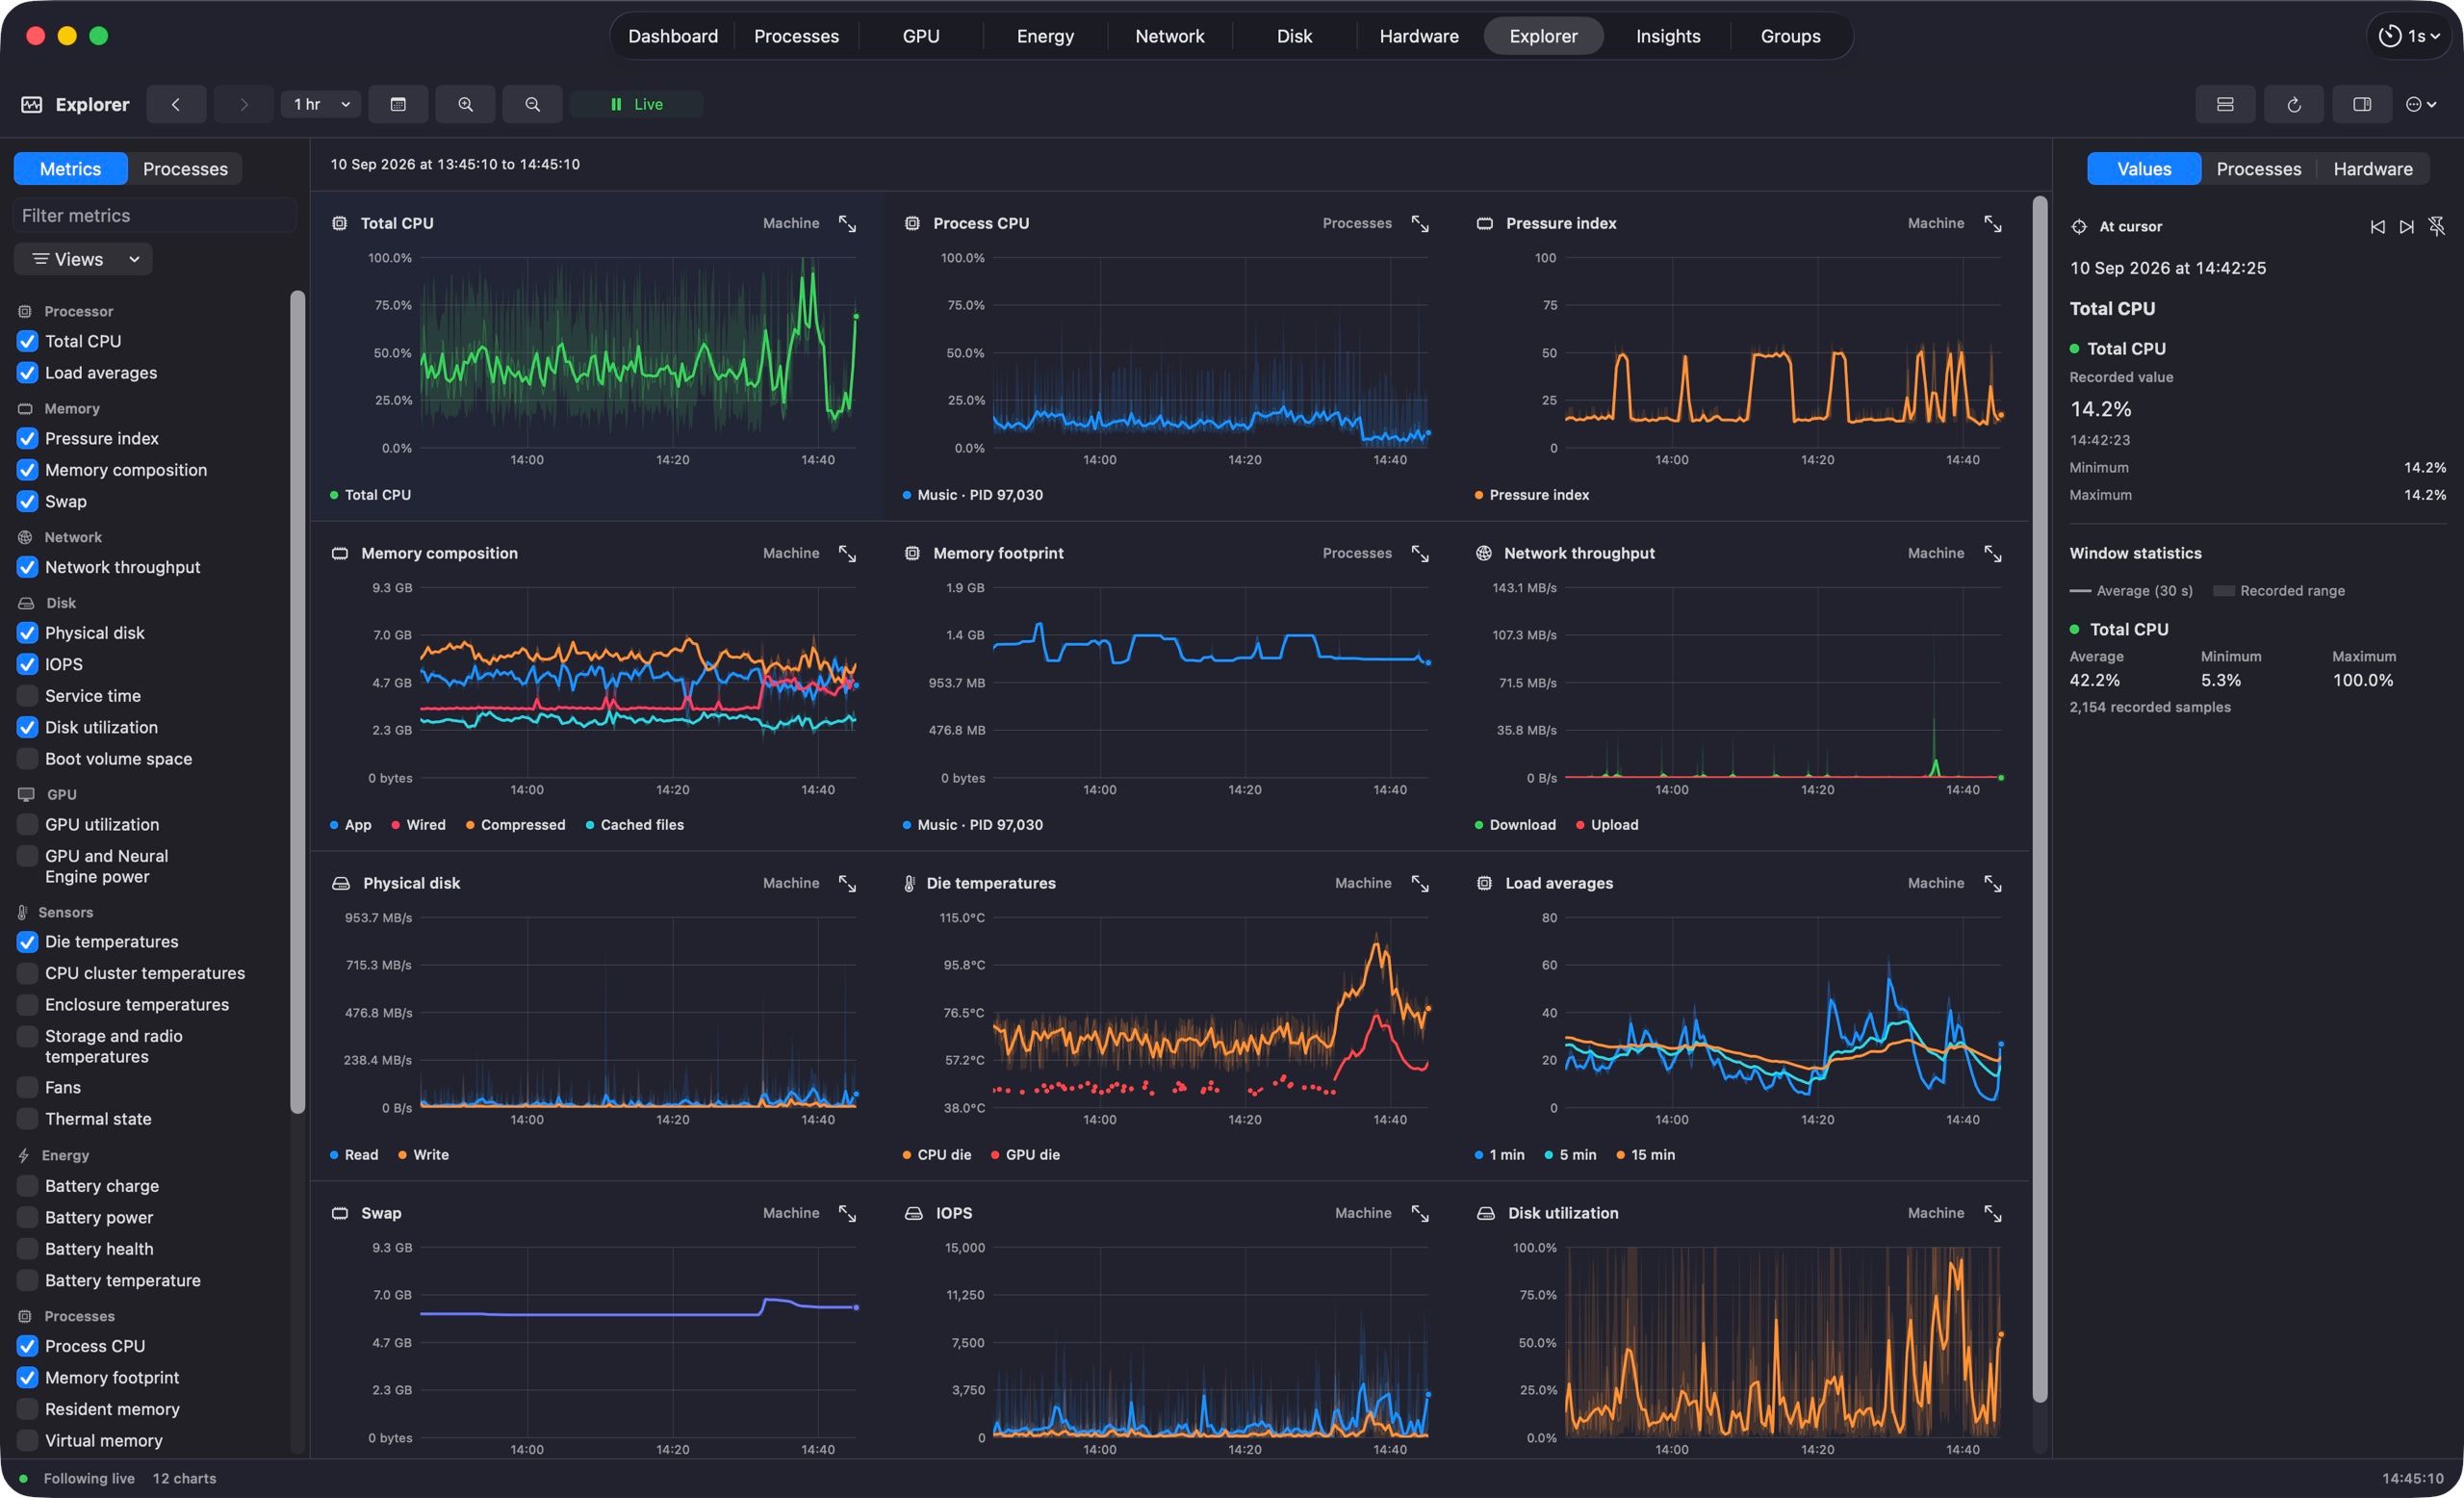
- Explorer. Pick a moment, add the charts you need, and compare up to 8 processes, including ones that have already quit. A shared cursor moves across all charts, and the visible data exports to CSV.
- Processes and groups. A sortable process table with CPU and memory history, open files, disk I/O and Rosetta status. Groups add up related apps and their helpers, for example a browser and all its tabs.
- GPU and Neural Engine. Per-process GPU use, power, memory and thermal limits. It recognises AI runtimes like Ollama, MLX and LM Studio.
- Energy. Battery health and cycles over months, power flow, temperatures, fans, and the battery levels of mice, keyboards and AirPods.
- Disk and network. Throughput, IOPS and drive health, a disk map to find large or old files, and optional per-app network traffic.
- Alerts on change. Instead of warning at a fixed swap threshold, it looks for memory that keeps growing or paging that strains the system. A separate check catches runaway processes fast.
- Ask About This Mac (preview). Plain reports without AI, or optional questions answered by a local model: Apple's on-device model by default, or Qwen. The AI can't run commands or change settings.
For business people
The problem: a Mac slows down, and by the time you open Activity Monitor the spike is over. You're left guessing whether it was a browser tab, a sync app or a background update.
What it gives you: a record. You open the window, scroll back to the moment, and see memory, CPU and disk next to the processes that used them. That turns "my Mac is slow" into "this app leaks memory every afternoon".
Cost: free. No account, no subscription.
Privacy: recorded data stays on the Mac. The app makes network requests only for update checks, model downloads and the network tools you start yourself.
The limits:
- Apple silicon and macOS 15 or later only.
- Young project. 3 months old, with frequent releases. The maker labels several features as "Preview", and the GPU bandwidth figures are estimates from macOS.
- Some features need extra permissions: Full Disk Access for app activity history, and a privileged helper for Neural Engine power.
- Translations: the German and French versions started as AI translations and still wait for review by native speakers.
For technical people
Install with Homebrew:
brew install --cask mac-performance-monitor
Or build from source:
git clone --branch main https://github.com/Zesty0wl/mac-performance-monitor.git
cd mac-performance-monitor
swift build
swift test
Scripts/run.sh
- Storage: samples go into a local SQLite database through GRDB.swift. Older data keeps the resolution it was stored at, and zooming doesn't invent detail.
- Updates: Sparkle. Homebrew's cask can lag a release, and
brew upgrade --greedyincludes it. - Local AI: the Ask feature runs on MLX and llama.cpp, with model weights downloaded separately.
- Build notes: the full app bundle needs Xcode 27. Ad-hoc signed builds can't use the privileged helper, so some sensors stay off in a self-built copy.
- Repository: the repo includes a
CLAUDE.md, so it's likely built with Claude Code's help.
How it compares
| App | Price | Approach |
|---|---|---|
| Mac Performance Monitor | Free, MIT | Recorder and investigation window, history per process |
| Stats | Free, MIT | Lightweight menu bar readouts |
| iStat Menus | Paid | Polished menu bar monitor with history graphs |
| Activity Monitor | Built in | Live view only, no recording |
Value
My Mac Studio runs local models through MLX and Ollama next to a dozen agents and servers. When it slows down, I want to know whether a model, a leaking Python process or a sync job caused it. The recorder with per-process history answers that after the fact, and the GPU view that recognises MLX and Ollama fits my setup.
I'd run the recorder in the background and open Explorer only when something feels off.
Further Reading